
January 2022 update
Hi everyone 👋
I wish you all a Happy New Year! 🎄🎅
This is a January report on the progress of Moiva.io.
Table split into categories
Moiva collects many different metrics and presents them in a table format as well as via charts.
In the past I organized all the charts by category ("Popularity", "Maintenance" and "Miscellaneous") to make it easier to digest them.
I noticed recently that the Table format also needs improvements:
- too much information is presented there at once
- it's hard to correlate information presented in Table and Charts
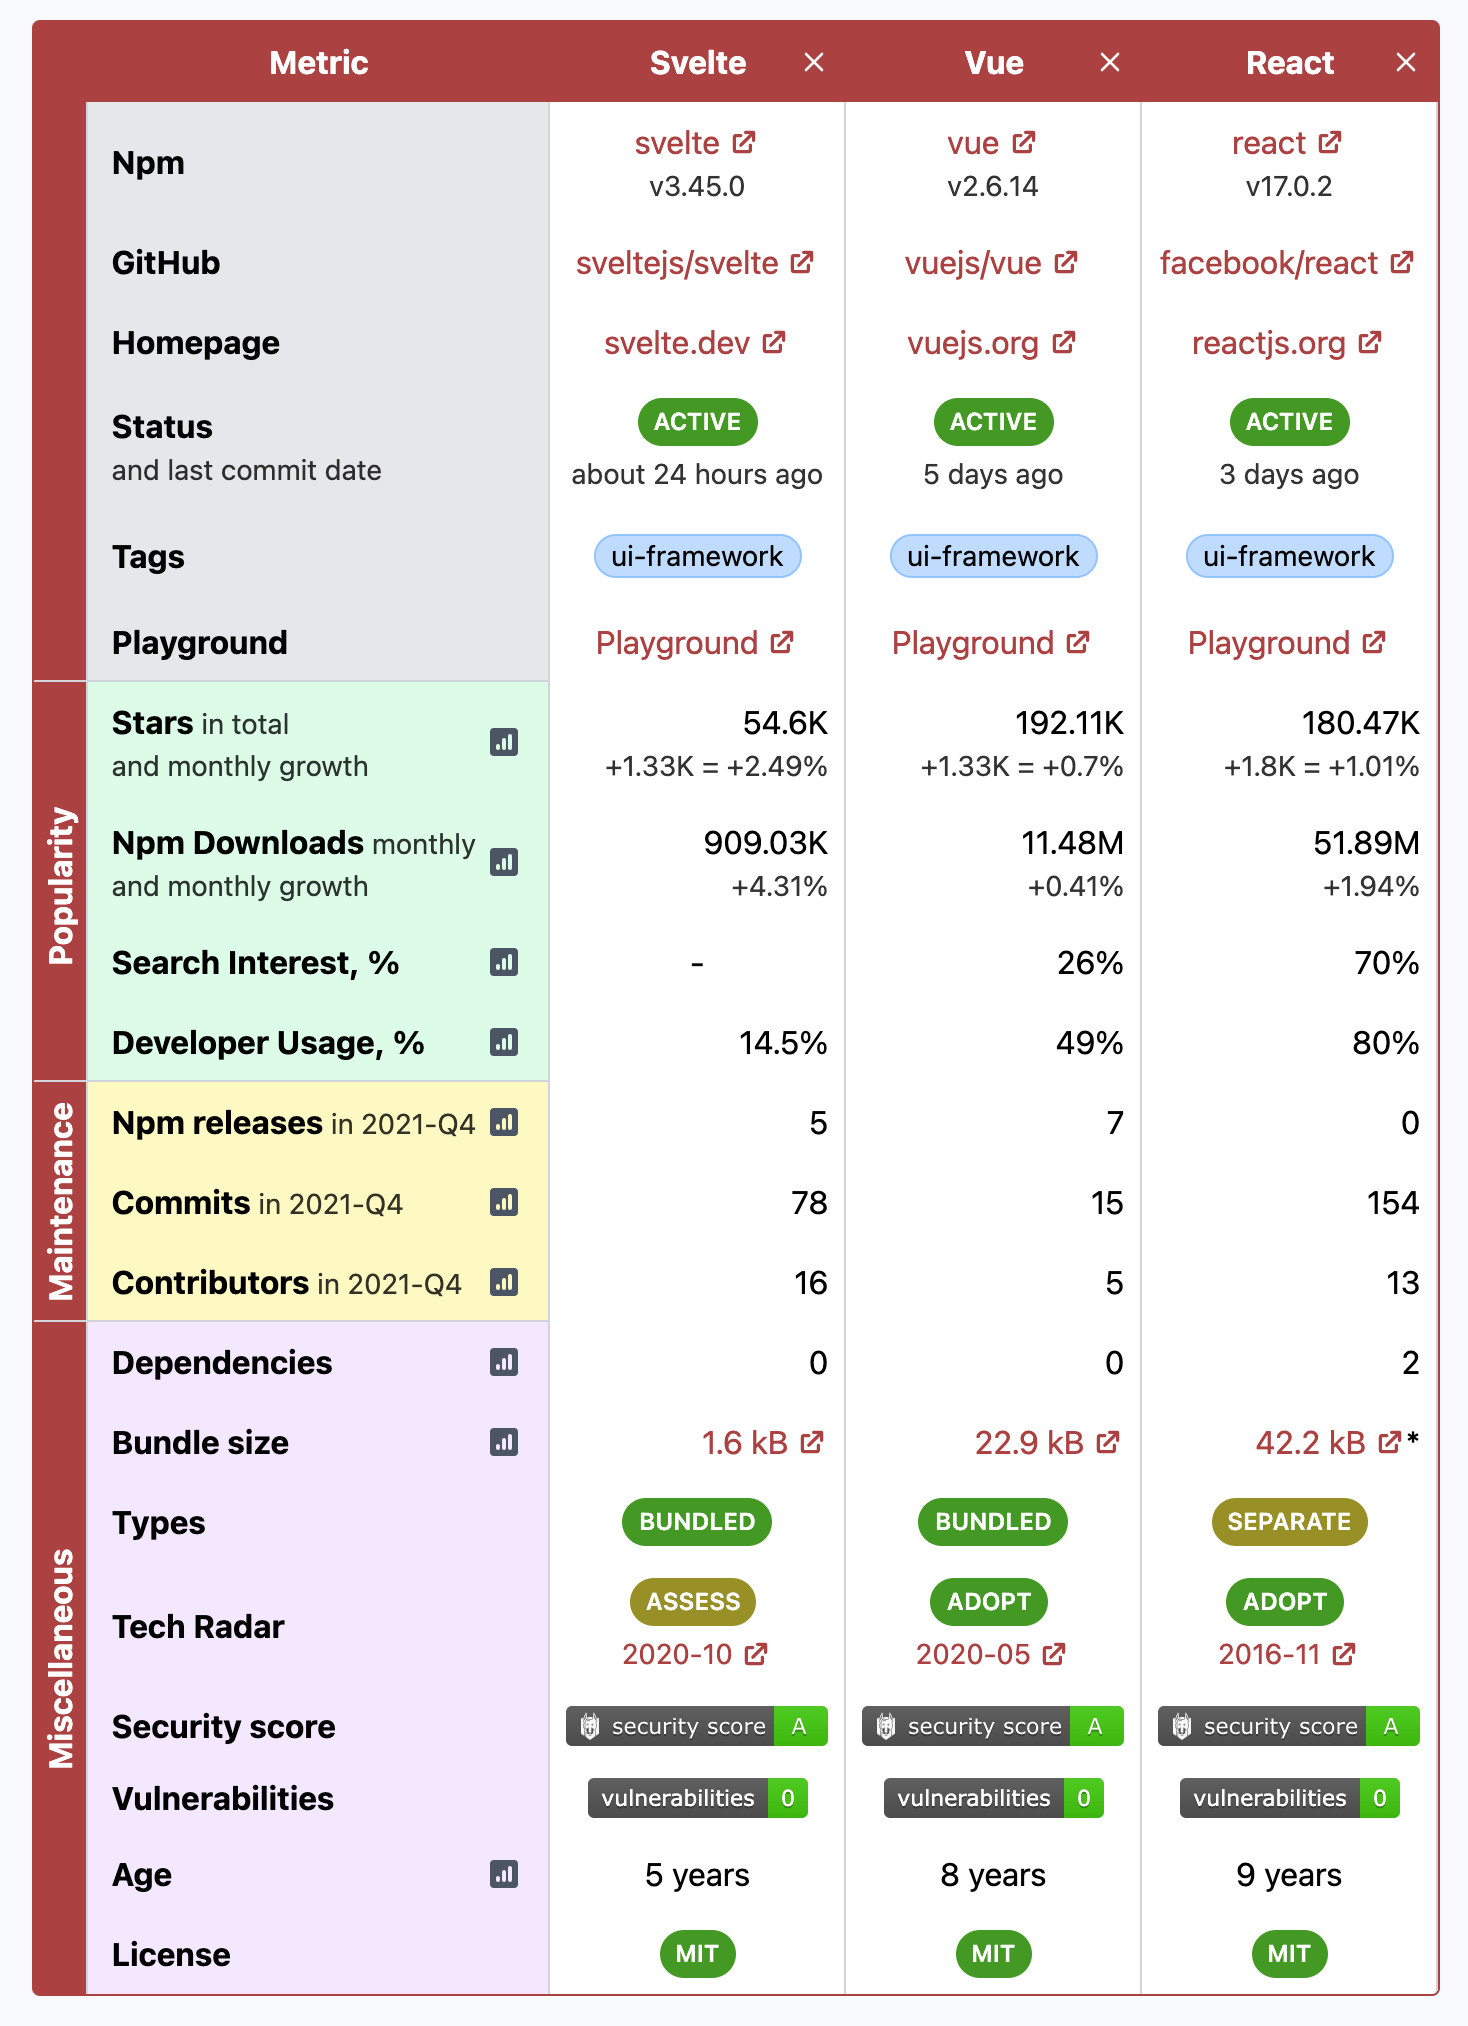
The following improvements were implemented:
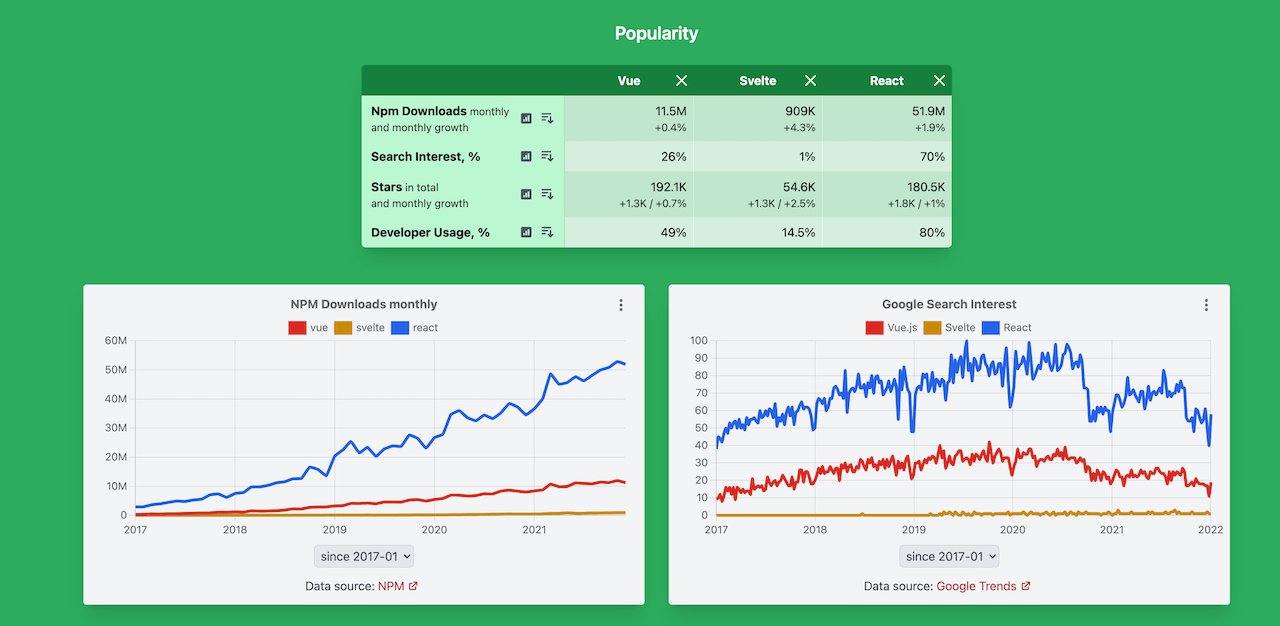
- the table was split into categories
- tables and charts from the same category were grouped together
Sorting by metric
When comparing numerous libraries at once, it might be handy to sort them by metrics.
I added a "Sort" button to each metric in the Table.
Misc
Other less prominent updates:
- added multiple new libraries to Moiva's catalog
- more libraries covered in Google Search Interest chart
- improved styling
- added new metric "Description" to the Table
- updated project's dependencies